Plotting Histograms
You can use the Histogram tool that is available in the Tools box to profile the intensity distribution of selected image data within a region of interest.
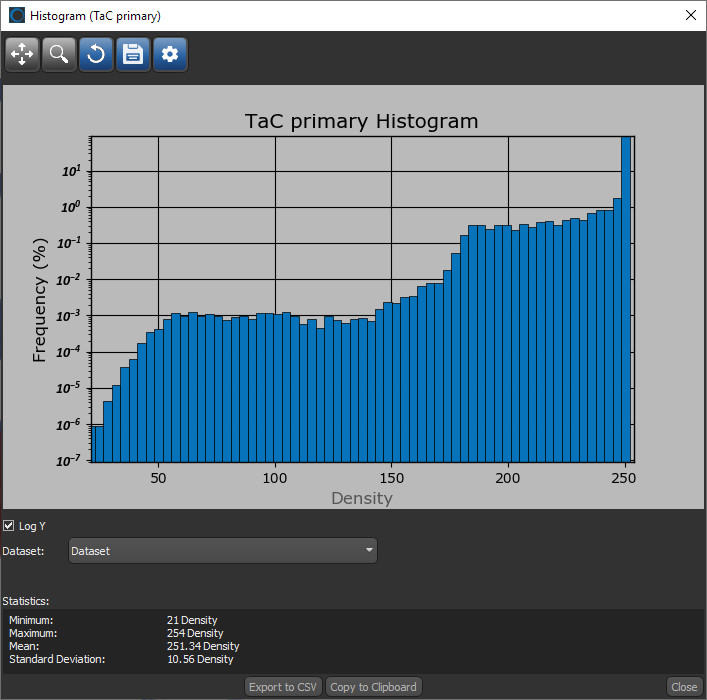
Histogram of an ROI
The following options and statistics are available for plotted histograms.
| Description | |
|---|---|
|
Y log |
If selected, the Y-axis will be plotted in log scale. |
|
Dataset |
Indicates the image data from which the values are plotted and provides a drop-down list for selecting other datasets. Note To be plotted in the Histogram dialog, the image data must be visible in the current scene and at least some of the labeled voxels within the region of interest must intersect with the image data. |
|
Statistics |
Minimum… Indicates the minimum intensity value* within the region of interest. Maximum… Indicates the maximum intensity value* within the region of interest. Mean… Indicates the mean intensity value* within the region of interest. Standard deviation… Indicates the standard deviation of intensity values* within the region of interest. * Values are calculated for the selected dataset and expressed in the native units of the dataset. |
|
Export to CSV |
Exports the histogram data to a comma-separated values file (*.csv extension). |
|
Copy to Clipboard |
Copies the statistics for the selected dataset to the clipboard. You can paste this information into any word processing or spreadsheet application. |
The tools at the top of the Histogram dialog let you to pan, zoom, and reset the histogram, as well as save the figure and adjust the representation.
|
|
Description | |
|---|---|---|
|
Pan |
|
Pans or zooms the figure as follows:
|
|
Zoom |
|
Zooms in or out on the figure, as follows:
|
|
Reset |
|
Resets the original view of the figure. |
|
Save |
|
Saves the figure as an image. Figures can be saved as a bitmap image in the JPEG, PNG, and TIFF file formats, as a vector graphic in the EPS or SVG file formats, or in the PDF file format. The figure can also be saved as raw data or in PG code for LaTeX. |
|
Settings |
|
Opens the Figure options dialog, shown below.
You can edit the figure title, as well as choose a range, label, and scale for the X and Y axes, as follows:
|

- Select the required region of interest in the Data Properties and Settings panel.
- Click the Histogram
 button in the Tools box in the bottom section of the Data Properties and Settings panel.
 - If required, select the dataset that will provide the data values in the Dataset drop-down menu.
The histogram of the selected region of interest appears.
- Adjust the figure, as required, with the tools at the top of the dialog.
- Select another dataset to plot its values in the histogram, if required.